Bitcoin Marketcap

$1.22T

Gold Marketcap

$14.18T

BTC Settlement Volume (24hr)

$12.90B

BTC Inflation Rate (next 1yr)

1.17%

logo CASEBITCOIN making the case for bitcoin every day

KEY MARKETS

24hr change

Bitcoin

$64,694  📈

+$397.78

+0.62%


S&P 500

5,086  📈

+49.27

+0.98%


Gold

$2,333  📈

+$15.36

+0.66%


Silver

$27.43  📈

+$0.28

+1.02%


Euro

$1.0729  📈

+$0.00

+0.30%


Yen

¥155.60  📈

+¥0.35

+0.23%


Renminbi (CNY)

¥7.2395   

-¥0.01

-0.09%


Oil (WTI)

$83.79  📈

+$0.96

+1.16%


BITCOIN STATS

Bitcoin Marketcap

$1.22T


BTC Inflation Rate (next 1yr)

1.17%


% Supply Issued

90.03%


BTC Settlement Volume (24hr)

$12.90B


Real Exchange Volume (24hr)

$27.25B


Active Addresses

1.02M


Mining Reward Value (24hr)

$59.3M


GBTC Premium

263.07%


MSTR Premium

65.30%


BTC Down From ATH

12.27%


BTC Up From Cycle Low

8.48%


RATES & YIELDS

24hr change

UST 3mo

5.46%  📈

+0.01

+0.18%


UST 2yr

4.86%  📉

-0.11

-2.21%


UST 10yr

4.61%  📉

-0.01

-0.22%


UST 30yr

4.73%  📈

+0.01

+0.21%


Fed Funds (EFFR)

5.33%  📈

+0

0%


US 10yr Breakeven Inflation

2.41%  📈

+0

0%


Real Rate (10yr)

2.20%  📉

-0.01

-0.45%


RATIOS

24hr change

Gold:BTC (marketcap)

11.60x   

+0.02

+0.13%


M2:BTC (marketcap)

17.05x   

-0.08

-0.49%


BTC:Oil (price)

771.61x   

-5.27

-0.68%


Gold:Oil (price)

27.84x   

-0.12

-0.42%


US GOVERNMENT STATS

30-day change

Federal Reserve Balance Sheet

$7.41T  📉


-1.45%


M1 Money Supply

$18.00T  📈

+$53.40B

+0.30%


M2 Money Supply

$20.84T  📈

+$57.60B

+0.28%


BTC ROI

Bitcoin & Traditional Assets ROI (vs USD)

BTC vs Traditional Assets ROI:


Bitcoin

Gold

S&P 500

1 year:

+129%

+17%

+25%

2 year:

+68%

+23%

+22%

3 year:

+26%

+31%

+22%

4 year:

+736%

+34%

+80%

5 year:

+1,158%

+82%

+73%

6 year:

+614%

+77%

+90%

7 year:

+4,776%

+84%

+113%

8 year:

+14,156%

+87%

+143%

9 year:

+28,702%

+93%

+141%

10 year:

+14,712%

+79%

+171%

11 year:

+46,494%

+60%

+221%

12 year:

+1.3 million%

+40%

+263%

13 year:

+2.0 million%

+51%

+273%

14 year:

+2.2 billion%

+100%

+325%

https://casebitcoin.com

Data Source: Messari.io, bitcoincharts.com

What is it: This shows bitcoin's ROI vs other potential inflation hedge assets.

Why it matters: As with the historical bitcoin price table, we see bitcoin's extreme outperformance vs other assets here as well. Bitcoin's relatively small size, plus fundamental properties, yield extreme outperformance when even relatively small funds-flows find their way to BTC.

BTC DAYS ABOVE PRICE

Bitcoin Price Closing History by Level

Days Bitcoin Closed Above:

Price

Days Above

% of Bitcoin's Life

$70,000

10

0.18%

$64,693

47

0.84%

$60,000

97

1.73%

$50,000

216

3.86%

$40,000

467

8.35%

$30,000

712

12.73%

Data Sources: Messari.io, bitcoincharts.com

What is it: This the number of days in which bitcoin "closed" (trading level at midnight UTC) above various price levels.

Why it matters: This can give a sense of where bitcoin is currently trading relative to past cycles.

SHARPE 5yr

DOUBLING TIME

Capital Flows into BTC Show Similarities to April 2017


Bitcoin is up over 250% in 2020, and over 40% in the past month alone. It's natural to wonder if the bitcoin rally has more to go, or if it's reached a longer-term top. Thankfully, we can look at both onchain network data, as well as price data, and compare to prior bitcoin cycles.


Analyst Willy Woo has done just that, comparing the growth in realized cap (a proxy for aggregate entry price) that we see now vs the 2017 bull run. Willy finds that growth now is comparable to April 2017:
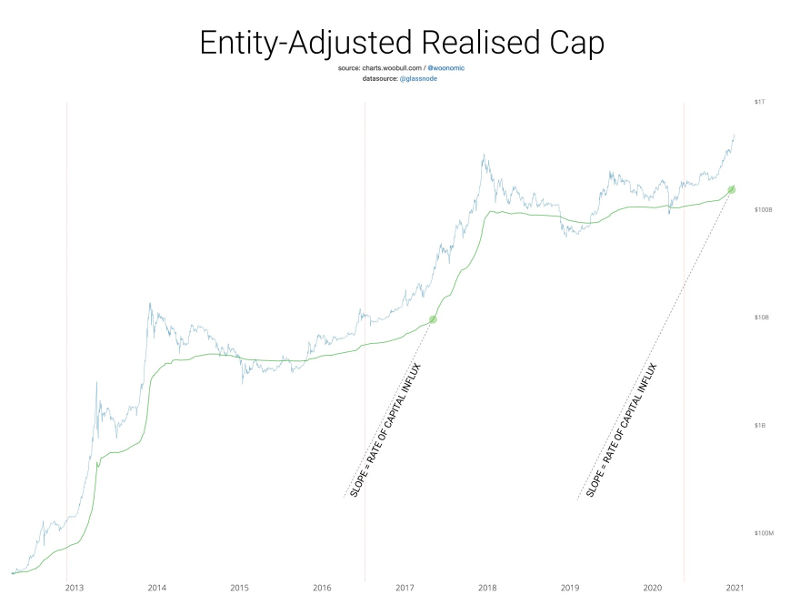
story image

tldr

  • Looking at the full bitcoin price chart, we see that April 2017 was near-ish a medium-term top that occurred in late May/June 2017, but far off from the December top that exceeded April's highest level by ~1400%.
  • A number of other onchain indicators are at levels equivalent to May 2017, suggesting BTC may indeed be near a medium-term top.
  • In any event, these indicators are just one way to gain some insight into the bitcoin market, and all onchain indicators that try and pick tops have significant room to run; mostly showing levels akin to early/mid 2017.

Are we missing a recent story that makes the case for bitcoin?

Tell us about it!


THE INVESTMENT CASE FOR BITCOIN

All you need to read to understand the investment case for bitcoin.

Bitcoin reminds me of gold when I first got into the business in 1976

- Paul Tudor Jones, Hedge Fund Manager

Frankly, if the gold bet works, the bitcoin bet will probably work better

- Stanley Druckenmiller - hedge fund manager

Bitcoin is a technological tour de force

- Bill Gates, Founder - Microsoft

[people] use [bitcoin] more as an alternative to gold. It’s a speculative store of value.

- Jerome Powell, Federal Reserve Chairman

There are 3 eras of currency: commodity based, politically based, and now, math based.

- Chris Dixon - Tech Investor, A16Z

Bitcoin may be the TCP/IP of money.

- Paul Buchheit - Gmail Creator

If they become widely accepted, virtual currencies could have a substitution effect on central bank money.

- European Central Bank - 2012

Bitcoin is Gold 2.0, a huge, huge deal.

- Chamath Palihapitiya - Founder & CEO Social Capital

I think every major bank, every major investment bank, every major high net worth firm is going to eventually have some exposure to bitcoin or what’s like it

- Bill Miller - Former Chainman & CIO, Legg Mason Capital

Bitcoin is money, everything else is credit.

- JP Morgan - 1912

MOST RECENTLY ADDED

We're adding to the library constantly. These are the newest additions.

MOST HELPFUL

Some pieces really crystalize the case for bitcoin. These are the highest rated from the CaseBitcoin community. 👍

MOST BULLISH

Rated by the CaseBitcoin community as most likely to make you feel bullish. 🚀